price ($)
year
miles (k)
1200
93
348
2800
93
173
2995
91
292
3000
91
200
3600
92
125
4500
95
184
4900
90
101
5000
95
131
5500
95
135
5900
95
115
5988
96
128
6000
91
84
6888
92
82
6995
94
88
7688
92
83
94
133
3000
92
204
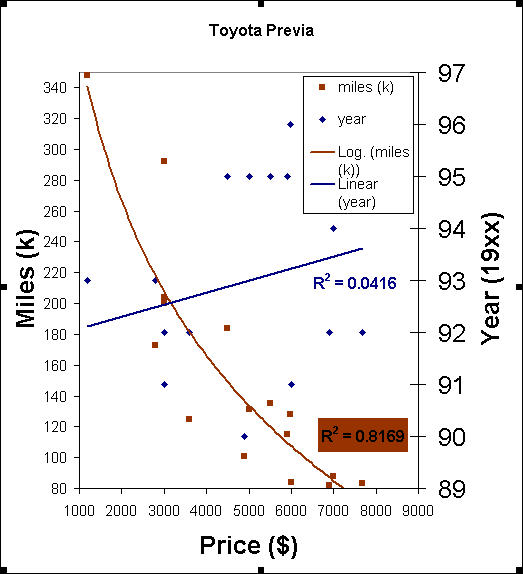
THE PRICE OF THE VEHICLE IS MUCH MORE DEPENDANT ON THE MILEAGE THAN THE YEAR.
The R^2 value indicates the fit of the line to the points.1 is the best, 0 the worst.
The year can be seen to have no measurable relationship, the mileage is a good correlation. The variance from the trend line probably reflects the condition of the van.